Technical Analysis
Moving Average
To analyze a situation on the price chart and forecast the further price movement you can use technical indicators. The technical indicators are the programs for the price chart analysis with different statistical and probability methods showing the results in the graphical format. You can install the technical indicators on a price chart, set necessary parameters for analysis and receive an answer to your question “where can the price move?” the indicator makes the fresh traders’ life easy as let them have the additional analysis instrument. The main task of using indicators is to understand the indicator settings and signals. The simplest indicator is Moving Average.
The Moving Average is a line indicator which let you see average value for a specified interval directly on the price chart.
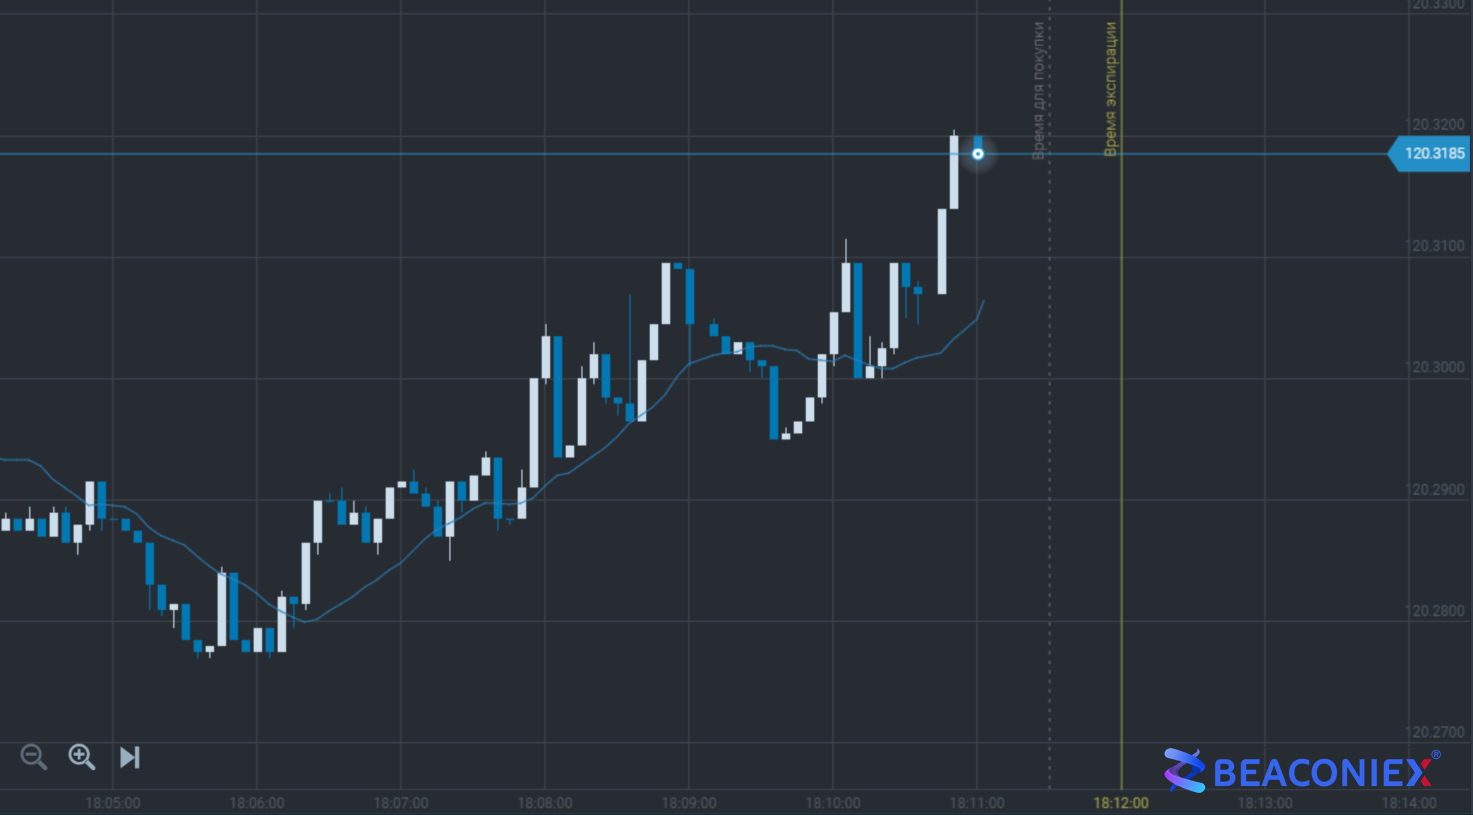
This indicator calculates the average value for a definite number of candlesticks or bars and shows the result as a point on the chart. For example, the moving average with a period 14 takes last 14 candlesticks, sums their closing prices up and divides into their total number. A new point appears with every new candlestick. You can see the example of MA on the chart :

The moving average is a trend indicator which shows good trading signals on the uptrends and downtrends.
There are some types of the moving averages depending on a calculation method:
1) Simple moving average is the average value for a specified period;
2) Weighted moving average – the average value calculation which includes a “weight” of the value considering its closeness to the current price, where the closest price is the heaviest one and the most distant price has the lowest weight;
3) Exponential moving average – the average value is calculated for a specified period by adding a definite share of the current price to the previous value and the share considers the price “weight”;
4) Smoothed moving average is calculated as the simple moving average for every previous value.
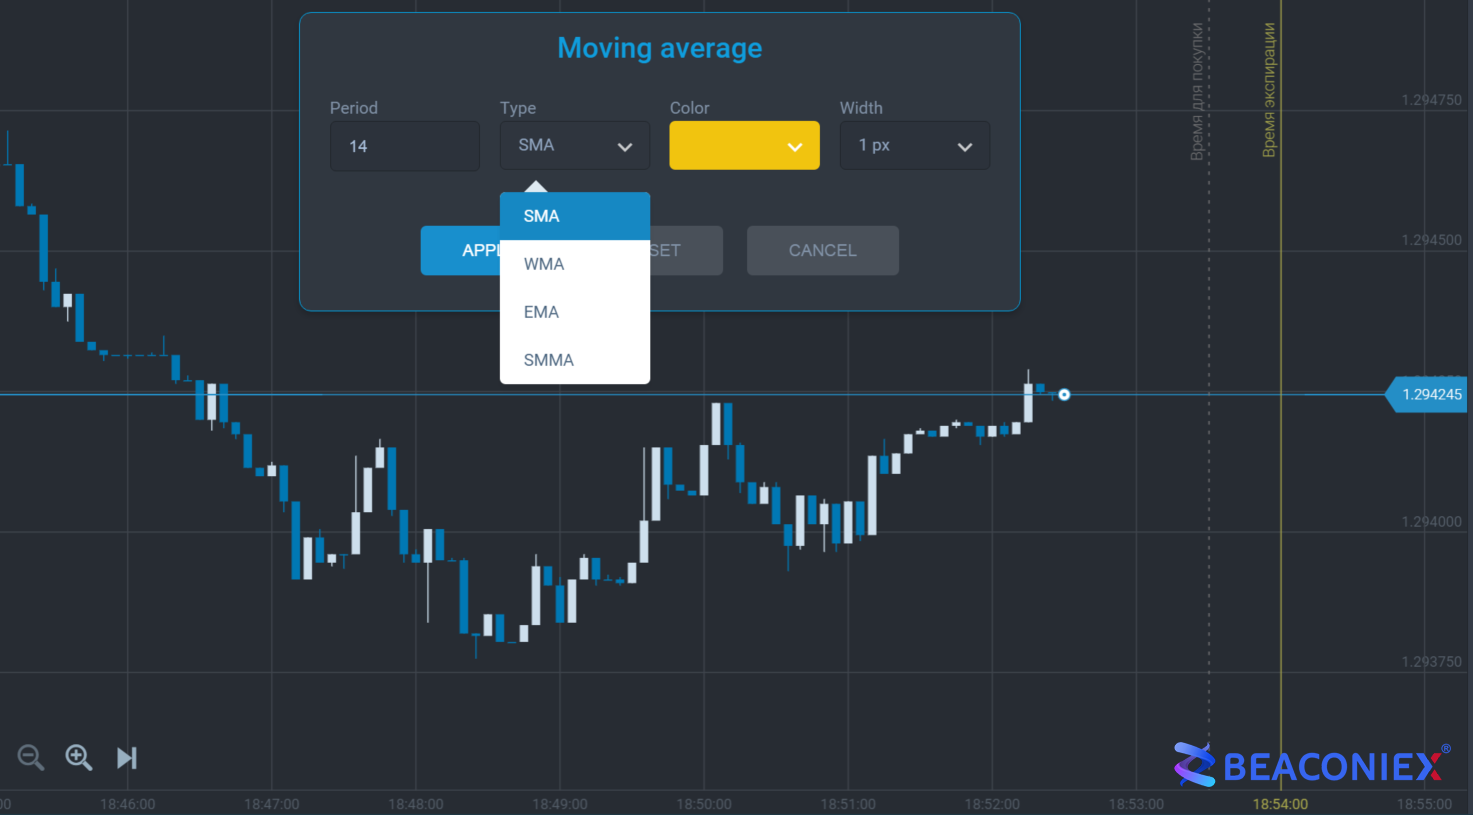
The moving average settings when adding to the chart will be as follows :

You should not be afraid of complications in the moving average calculations as there is no need to know all formulas when using them. You should remember only the signals they give. Different types of the moving averages with the same settings are not much different on the chart. The formula of the moving average calculation is important for trading systems with fine settings. We will need only the simple moving average as an initial instrument for the online trading.
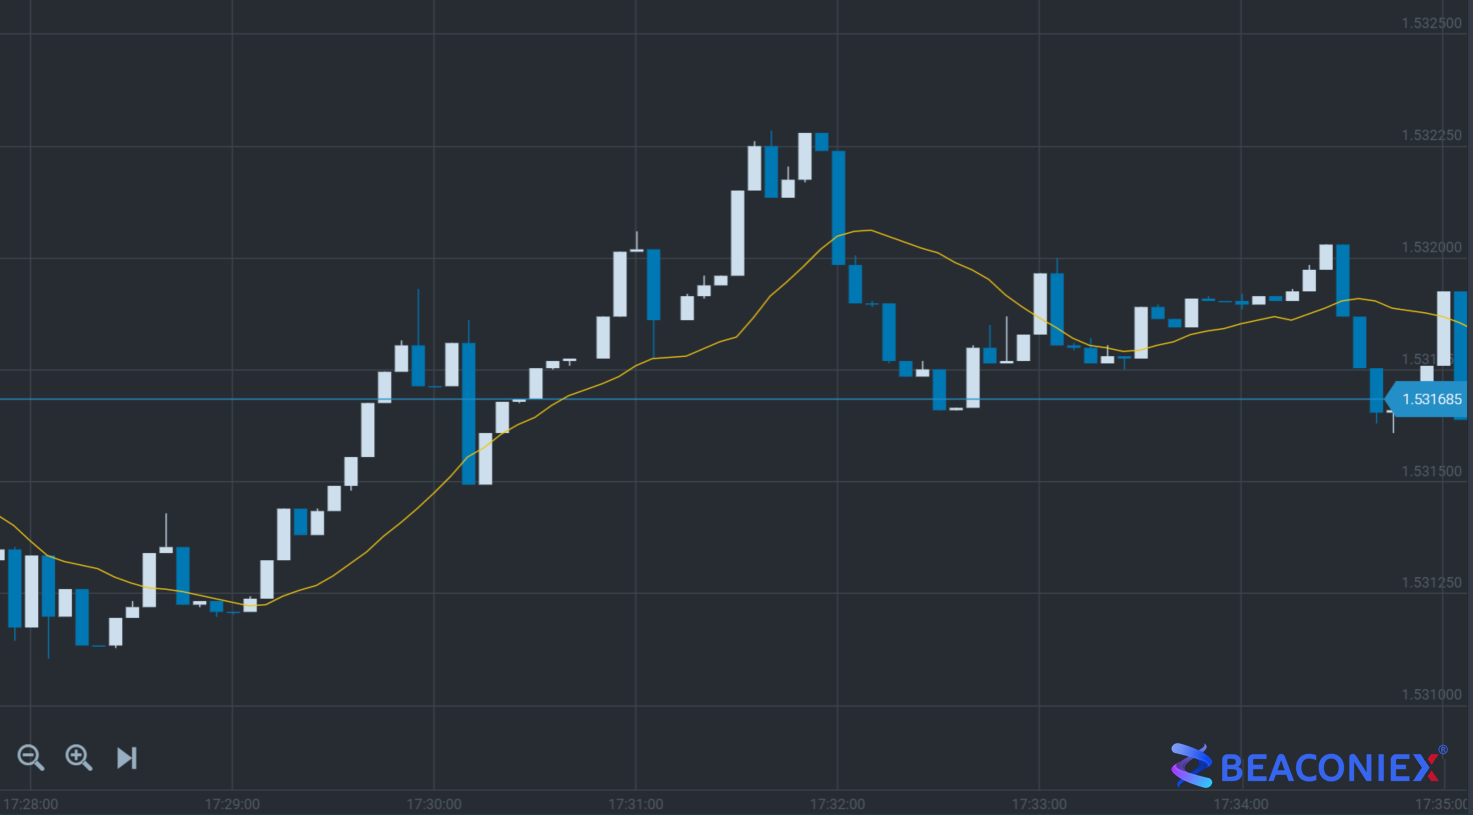
There are some ways to use this indicator on the chart. The simplest one is to receive a signal when the price chart crosses the moving average:

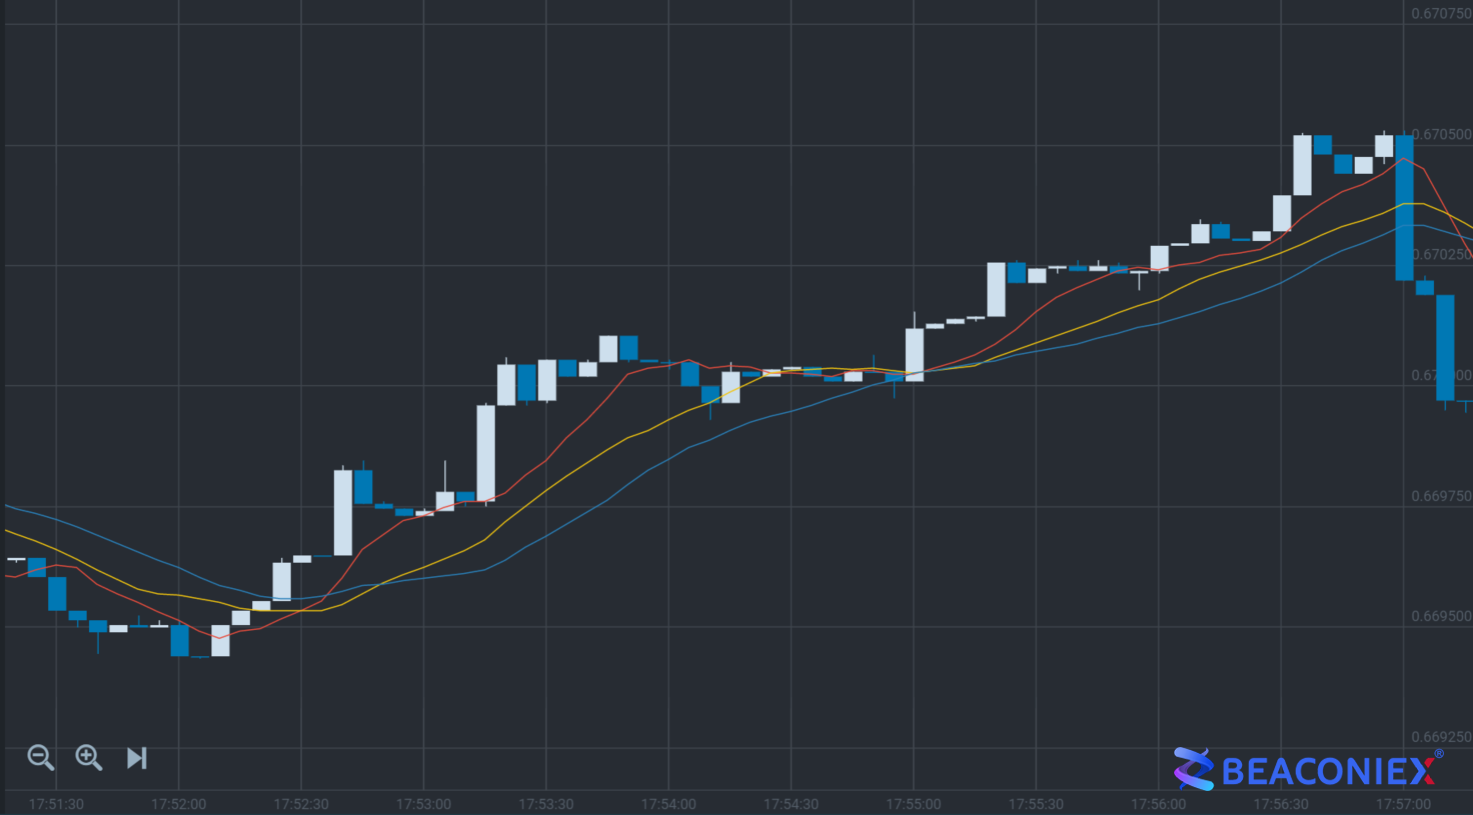
As we can see on the picture a signal to trade appears when the price chart crosses the moving average below, and a signal trade online appears when the price chart crosses MA above. You can also use some moving averages to receive the more accurate signals. To receive the truer signal you can use three simple moving averages with periods 7, 14 and 21. When the price chart crosses SMA (7) bellow it will be the main signal that the tendency direction is being changed and you should prepare to buy. The price continues moving upwards and SMA (7) following it will cross SMA (14) bellow because the moving average with the shorter period responds to the tendency change quicker. It gives us a second signal and the first confirmation that price movement has changed its direction. Some fresh traders can start buying here but as the period is less than a minute there can be many false signals. So after our SMA (14) has been crossed by the price chart and faster moving average it also starts curving upwards following the price. When it has crossed the slowest SMA (21) bellow we will see the next signal and second confirmation to buy. And at this moment we can buy call options. In the following picture you can see the example:

The problem in using of the long-term moving averages is their delay, so it is better to use them for a confirmation of the trading signal. Also the long-term MAs can be the support and resistance levels for the current trend and give extra signals to buy or sell.
As we see, the moving averages are simple in use and give good trading signals. Use of some indicators with the different periods on the chart is very convenient and gives more opportunities for a successful trading. The MAs are good trend indicators showing the moment when the price chart direction was changed. The only fault of this indicator is that it cannot show the good signals during the flat. Fortunately, the sideway trend is an unusual situation in the market and has a short period. So the MA is the simple and easy indicator.