Technical Analysis
Alligator
The Alligator indicator is the most interesting of all trend indicators. It was introduced by famous and successful trader Bill Williams, the author of the Chaos Theory. His indicator is strange not only because of its name but because it has all animal qualities: it can “sleep” or “open its mouth” if hungry. These two indicator properties have the practical meaning – they are the trading signals not to trade (when an alligator is sleeping) or to trade in the direction of the open mouth.
Let’s try to understand it. The first fact you should know is that the indicator is based on 3 moving averages with different period displaced to some bars. The indicator standard settings will be as follows :
1) The Alligator’s Jaw is the 13-period smoothed moving average (SMMA) built on the bar average value (a sum of maximum and minimum prices divided into two) and moved into the future by 8 bars;
2) The Alligator’s Teeth is the 8-period SMMA built on a median price and moved into the future by 5 bars;
3) The Alligator’s Lips is the 5-period smoothed moving average (SMMA) moved into the future by 3 bars.
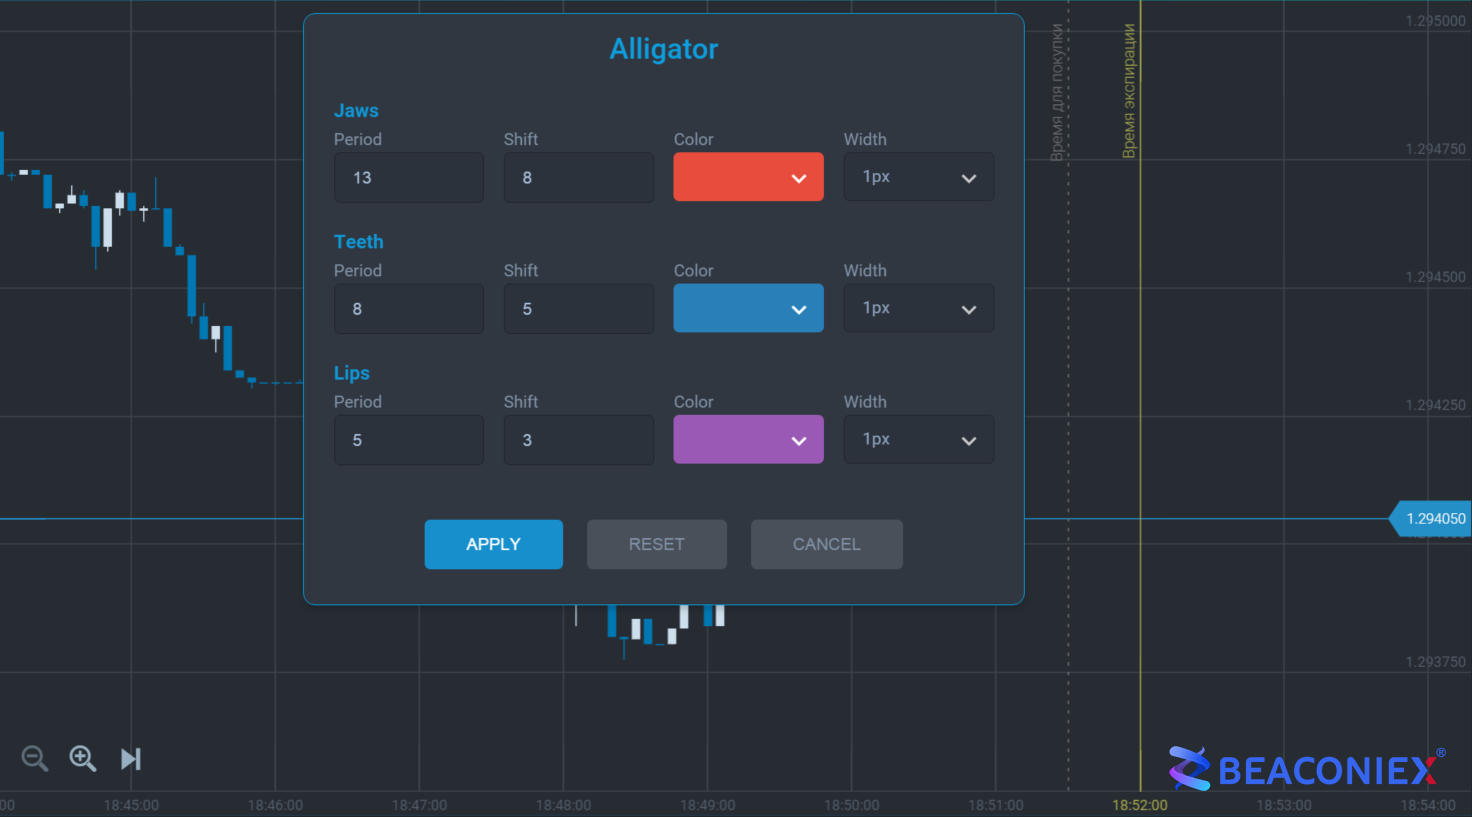
Here is an example of the Alligator settings when installing :

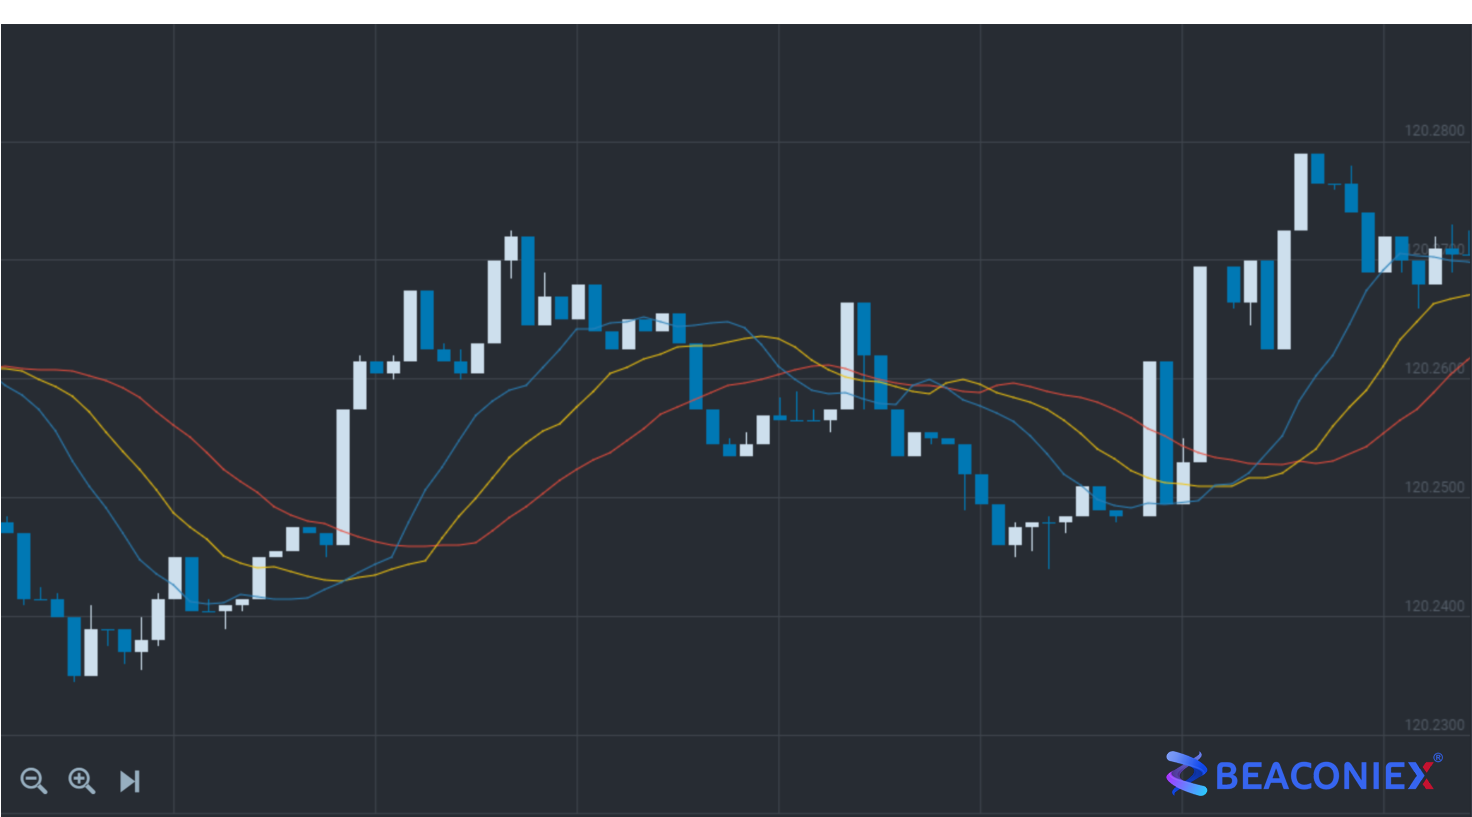
Alligator indicator will look on the chart as follows :
There are some types of the moving averages depending on a calculation method:

You should not be afraid of complications in the moving average calculations as there is no need to know all formulas when using them. You should remember only the signals they give. Different types of the moving averages with the same settings are not much different on the chart. The formula of the moving average calculation is important for trading systems with fine settings. We will need only the simple moving average as an initial instrument for the online trading.
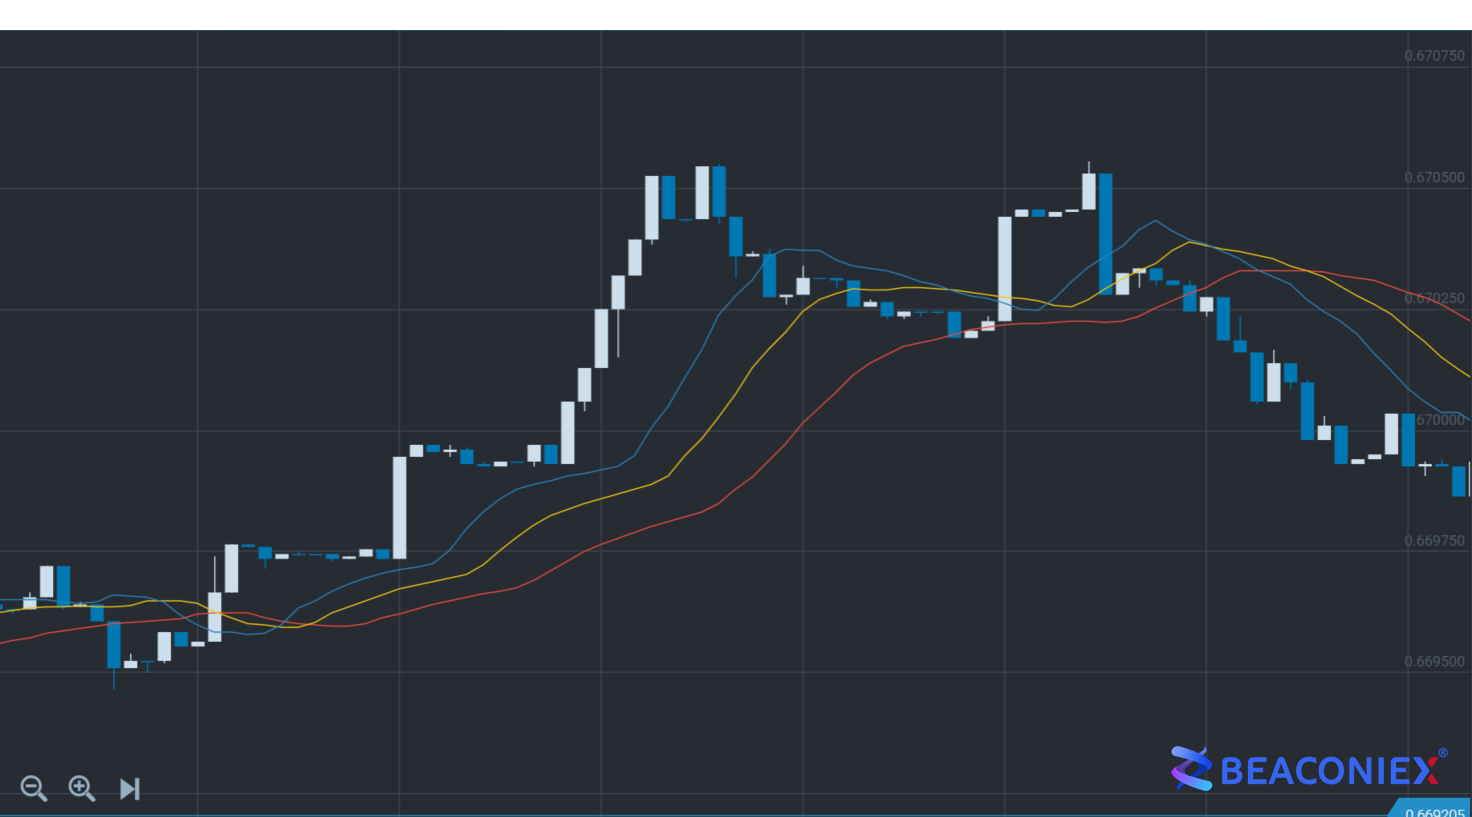
There are some ways to use this indicator on the chart. The simplest one is to receive a signal when the price chart crosses the moving average :

At first it may seem difficult, but if we remember the method of working with three averages we will see the same situation – the fast average crosses the slower one and gives a signal to trade. If the price chart is above the indicator we trade online and in a reverse situation when the chart is below the indicator we can buy puts.
At first it may seem difficult, but if we remember the method of working with three averages we will see the same situation – the fast average crosses the slower one and gives a signal to trade. If the price chart is above the indicator we trade online and in a reverse situation when the chart is below the indicator we can buy puts.
To understand how the indicator works we recommend you to install it on your chart and test its signals on the quotes history. Such training let you get used to a currency pair and understand its signals. You can also watch trading signals on a real time chart.
Online trading in the small intervals let you understand how the indicator works on a definite currency. And when you understand how to open deals you will start to earn. But always remember: no trading while the alligator is sleeping.